7. The most important families of theoretical distribution.
Theoretical distribution is when you know what the distribution is and its parameters
Empirical distribution is when we start knowing nothing. What we have is a collection of observations, and we want to try and derive some knowledge from that collection.
Continuous distribution
- Uniform distribution:- is a type of distribution in which all outcomes are equally likely; each variable has the same probability that it will be the outcome. A deck of cards has within it uniform distributions because the likelihood of drawing a heart, a club, a diamond or a spade is equally likely. A coin also has a uniform distribution because the probability of getting either heads or tails in a coin toss is the same. The continuous uniform distribution or rectangular distribution is a family of symmetric probability distributions. The distribution describes an experiment where there is an arbitrary outcome that lies between certain bounds. The bounds are defined by the parameters, a and b, which are the minimum and maximum values, the interval can be either closed. Therefore, the distribution is often abbreviated U (a, b), where U stands for uniform distribution. The difference between the bounds defines the interval length; all intervals of the same length on the distribution’s support are equally probable.

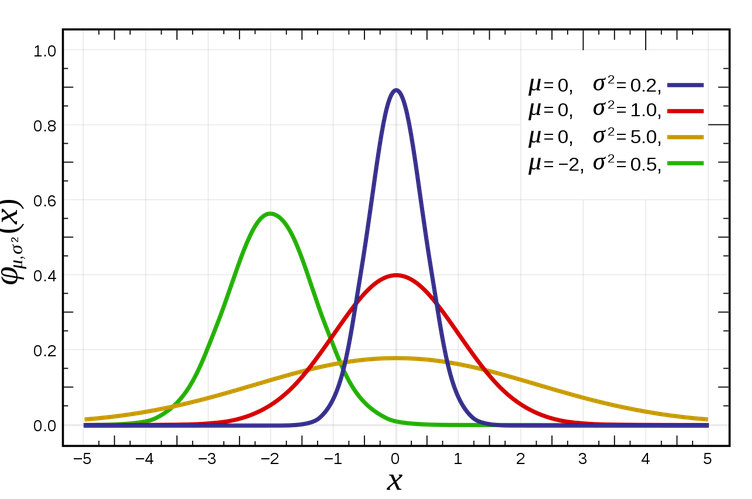
- Normal distribution:- Normal distribution, also known as the Gaussian distribution, is a theoretical distribution that is symmetric about the mean, showing that data near the mean are more frequent in occurrence than data far from the mean. The normal distribution is useful because of the central limit theorem. In its most general form, under some conditions (which include finite variance), it states that averages of samples of observations of random variables independently drawn from the same distribution converge in distribution to the normal, that is, they become normally distributed when the number of observations is sufficiently large. Physical quantities that are expected to be the sum of many independent processes (such as measurement errors) often have distributions that are nearly normal.

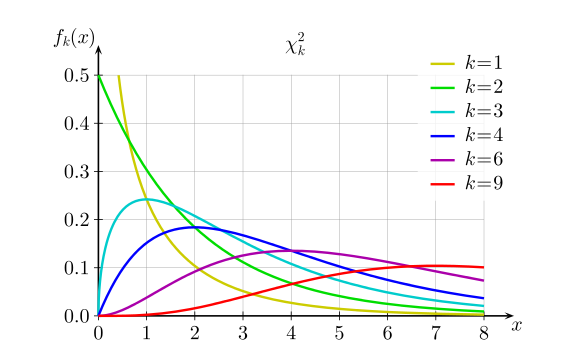
- chi square:- The chi-square distribution (also chi-squared or χ2-distribution) with k degrees of freedom is the distribution of a sum of the squares of k independent standard normal random variables. The chi-square distribution is a special case of the gamma distribution and is one of the most widely used probability distributions in inferential statistics, notably in hypothesis testing or in construction of confidence intervals.

- gamma:- The gamma distribution is a two-parameter family of continuous probability distributions. The exponential distribution, Erlang distribution, and chi-squared distribution are special cases of the gamma distribution.

- beta:- the beta distribution is a family of continuous probability distributions defined on the interval [0, 1] parametrized by two positive shape parameters, denoted by α and β, that appear as exponents of the random variable and control the shape of the distribution. It is a special case of the Dirichlet distribution.

- exponential:- the exponential distribution is the probability distribution of the time between events in a Poisson point process, i.e., a process in which events occur continuously and independently at a constant average rate. It is a particular case of the gamma distribution. It is the continuous analogue of the geometric distribution, and it has the key property of being memoryless. In addition to being used for the analysis of Poisson point processes it is found in various other contexts.

### Discrete distribution
- Boolean:– a distribution with value either true or flase.
- Binomial:- is a distribution that has the following properties:
- The experiment consists of n repeated trials.
- Each trial can result in just two possible outcomes. We call one of these outcomes a success and the other, a failure.
- The probability of success, denoted by P, is the same on every trial.
- The trials are independent that is, the outcome on one trial does not affect the outcome on other trials. The binomial distribution with parameters n and p is the discrete probability distribution of the number of successes in a sequence of n independent experiments, each asking a yes–no question, and each with its own boolean-valued outcome: success/yes/true/one (with probability p) or failure/no/false/zero (with probability q = 1 − p). A single success/failure experiment is also called a Bernoulli trial or Bernoulli experiment and a sequence of outcomes is called a Bernoulli process; for a single trial, i.e., n = 1, the binomial distribution is a Bernoulli distribution. The binomial distribution is the basis for the popular binomial test of statistical significance.

- Multinomial:- is almost identical with one main difference: a binomial experiment can have two outcomes, while a multinomial experiment can have multiple outcomes.
